Arduino Nano Battery and Accumulator Capacity and Internal Resistance Tester. This is a project I started at the request of one of our readers. I also work with Li-ion cells from time to time and I enjoy related projects. I progressed from internal resistance measurement of cells to this project.
The implemented Arduino project is a battery analyzer device that can perform capacity, Wh, internal resistance, and constant-current load tests on different battery types, from 18650 Li-ion cells to small lead-acid batteries.
The basic idea of the circuit was taken from an older ATmega328P-based battery analyzer project. The source code was adapted so it could be used with Arduino Nano, and some improvements were made according to the problems encountered during workshop tests.
The aim of the project is not only to discharge a battery and see the mAh value. It also allows you to observe how much the battery voltage sags under load, approximately what level its internal resistance is, how the cell, battery, or power supply behaves in constant-current load mode, and how the Wh value is formed at the end of the test.
I prepared this application especially for single-cell 18650 Li-ion cells. However, the original operating range of the circuit is approximately between 0.8 V and 20 V. You can modify the code according to your needs; how to do this is also explained in the article.
For this reason, if a suitable termination voltage and current value are selected, it can also be used with different types of cells and batteries.
For basic information about 18650 cells, you can also refer to a previously published article explaining what a 18650 cell is.
Main Features of the Project
Contents
- 1 Main Features of the Project
- 2 Block Diagram of the Arduino Nano Battery and Accumulator Capacity Tester
- 3 Starting Point of the Project and Adaptation to Arduino Nano
- 4 General Operating Principle of the Circuit
- 5 Main Sections Used
- 5.1 Arduino Nano and Control Section
- 5.2 LCD 20×4 Display (LCD2004)
- 5.3 MOSFET and Electronic Load Section
- 5.4 MOSFET Selection: 18650 Cell Testing and High-Power Use
- 5.5 Powerful MOSFET Alternatives That Can Be Used Instead of IRFP260N
- 5.6 TO-220 MOSFET Recommendations for 18650 Cell and 1A – 1.5A Tests
- 5.7 Which MOSFET Makes More Sense for Which Use?
- 5.8 Shunt Resistors
- 6 LM358 and Op-Amp Selection
- 7 LM35 Temperature Sensor and Fan Control
- 8 Arduino Nano Pin Connections
- 9 Adapting the Software to Arduino Nano
- 10 Operating Modes
- 11 Points to Consider in Internal Resistance Measurement
- 12 How Should the Internal Resistance Value Be Interpreted?
- 13 What Is the Settings Menu Used For?
- 14 Software Corrections Made in Measure Capacity Mode
- 15 Calibration
- 16 Customization Settings That Can Be Made in the Code
- 16.1 1. Changing the Capacity Test Termination Voltage
- 16.2 Returning to the Original 0.8V – 20V Range
- 16.3 A More Reasonable General-Purpose Setting
- 16.4 2. Changing the Default Discharge Current
- 16.5 3. Changing the Default I1 / I2 Current in Internal Resistance Measurement
- 16.6 4. Changing Internal Resistance Current Options
- 16.7 5. Enabling or Disabling the LM35 Temperature Sensor
- 16.8 6. Changing Fan On / Off Temperatures
- 16.9 7. Changing the ADC Averaging Count
- 16.10 8. Changing the Default ADC Offset Value
- 16.11 9. Changing the Default State of Sound Settings
- 16.12 10. Changing Buzzer Durations
- 16.13 11. Changing Button Response
- 16.14 12. Changing Display Text
- 16.15 13. Changing Pins
- 16.16 14. Do Not Change the Timer Settings
- 16.17 15. PWM Frequency and Timer Settings
- 16.18 Summary
- 17 Safe Test Sequence
- 18 Cooling and Power Rating
- 19 Recommended Starting Settings for 18650 Testing
- 20 Arduino Battery Tester Test Video
- 21 Arduino Battery Analyzer PCB Design
- 22 Conclusion
| Feature | Value / Description |
|---|---|
| Microcontroller | ATmega328P on the Arduino Nano |
| Operating modes | Measure capacity, Constant current, Measure internal R |
| Battery voltage range | Approximately 0.8 V * – 20 V |
| Voltage measurement step | Approximately 0.01 V |
| Discharge current | Software selectable from 0.01 A to 2.50 A |
| Measured values | V, A, mAh, mWh, time, internal resistance |
| Display | 20×4 character LCD, HD44780 compatible |
| Load element | Powerful N-channel MOSFET operating in the linear region |
| Current sensing | 3×0.33 ohm shunt resistors connected in parallel |
| Op-amp supply | 9 V |
| Logic supply | 5 V |
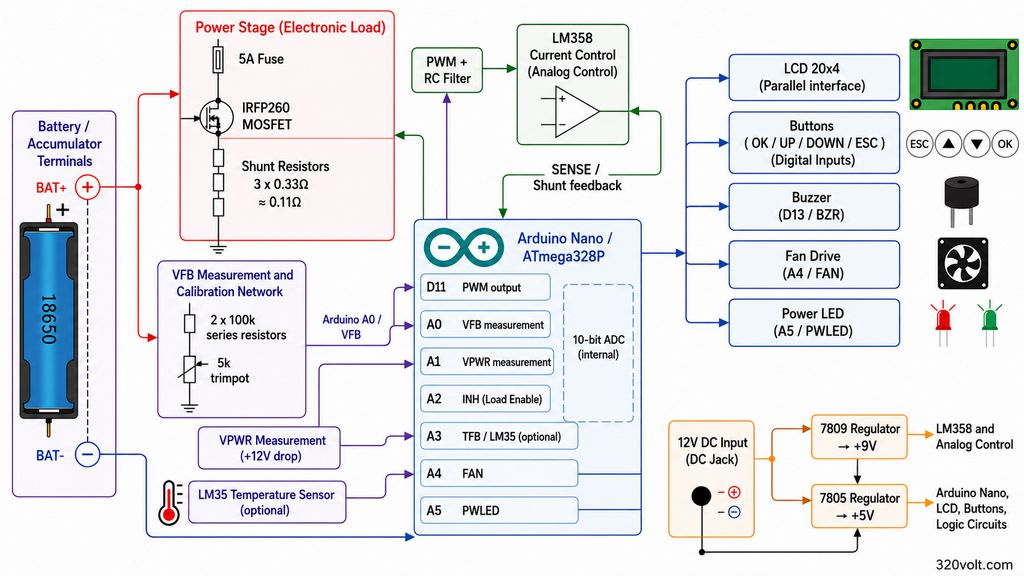
Block Diagram of the Arduino Nano Battery and Accumulator Capacity Tester
Starting Point of the Project and Adaptation to Arduino Nano
The original software was written in AVR C by @F. Stefanec. Source page: tefatronix.g6.cz/display.php?page=batmeter
Code::Blocks was used as the development environment, AVR-GCC as the compiler, and avrdude with USBasp on the programming side.
Since the original circuit also uses an ATmega328P, adapting it to the Arduino Nano worked well. This is because the Arduino Nano uses the same microcontroller family.
On the code side, the process was not to rewrite the project from scratch using Arduino libraries, but to preserve the logic of the original AVR C code and make it compilable under the Arduino IDE and uploadable through the Arduino Nano bootloader.
Therefore, direct port register usage was preserved in many parts of the code.
| Original Project | Arduino Nano Adaptation |
|---|---|
| ATmega328P | ATmega328P on the Arduino Nano |
| Code::Blocks | Arduino IDE |
| AVR-GCC | AVR-GCC infrastructure of the Arduino IDE |
| Programming with USBasp | Programming through the USB bootloader |
| main() loop | setup() and loop() structure |
| AVR register usage | Largely preserved |
General Operating Principle of the Circuit
Arduino Nano battery and accumulator capacity tester circuit schematic
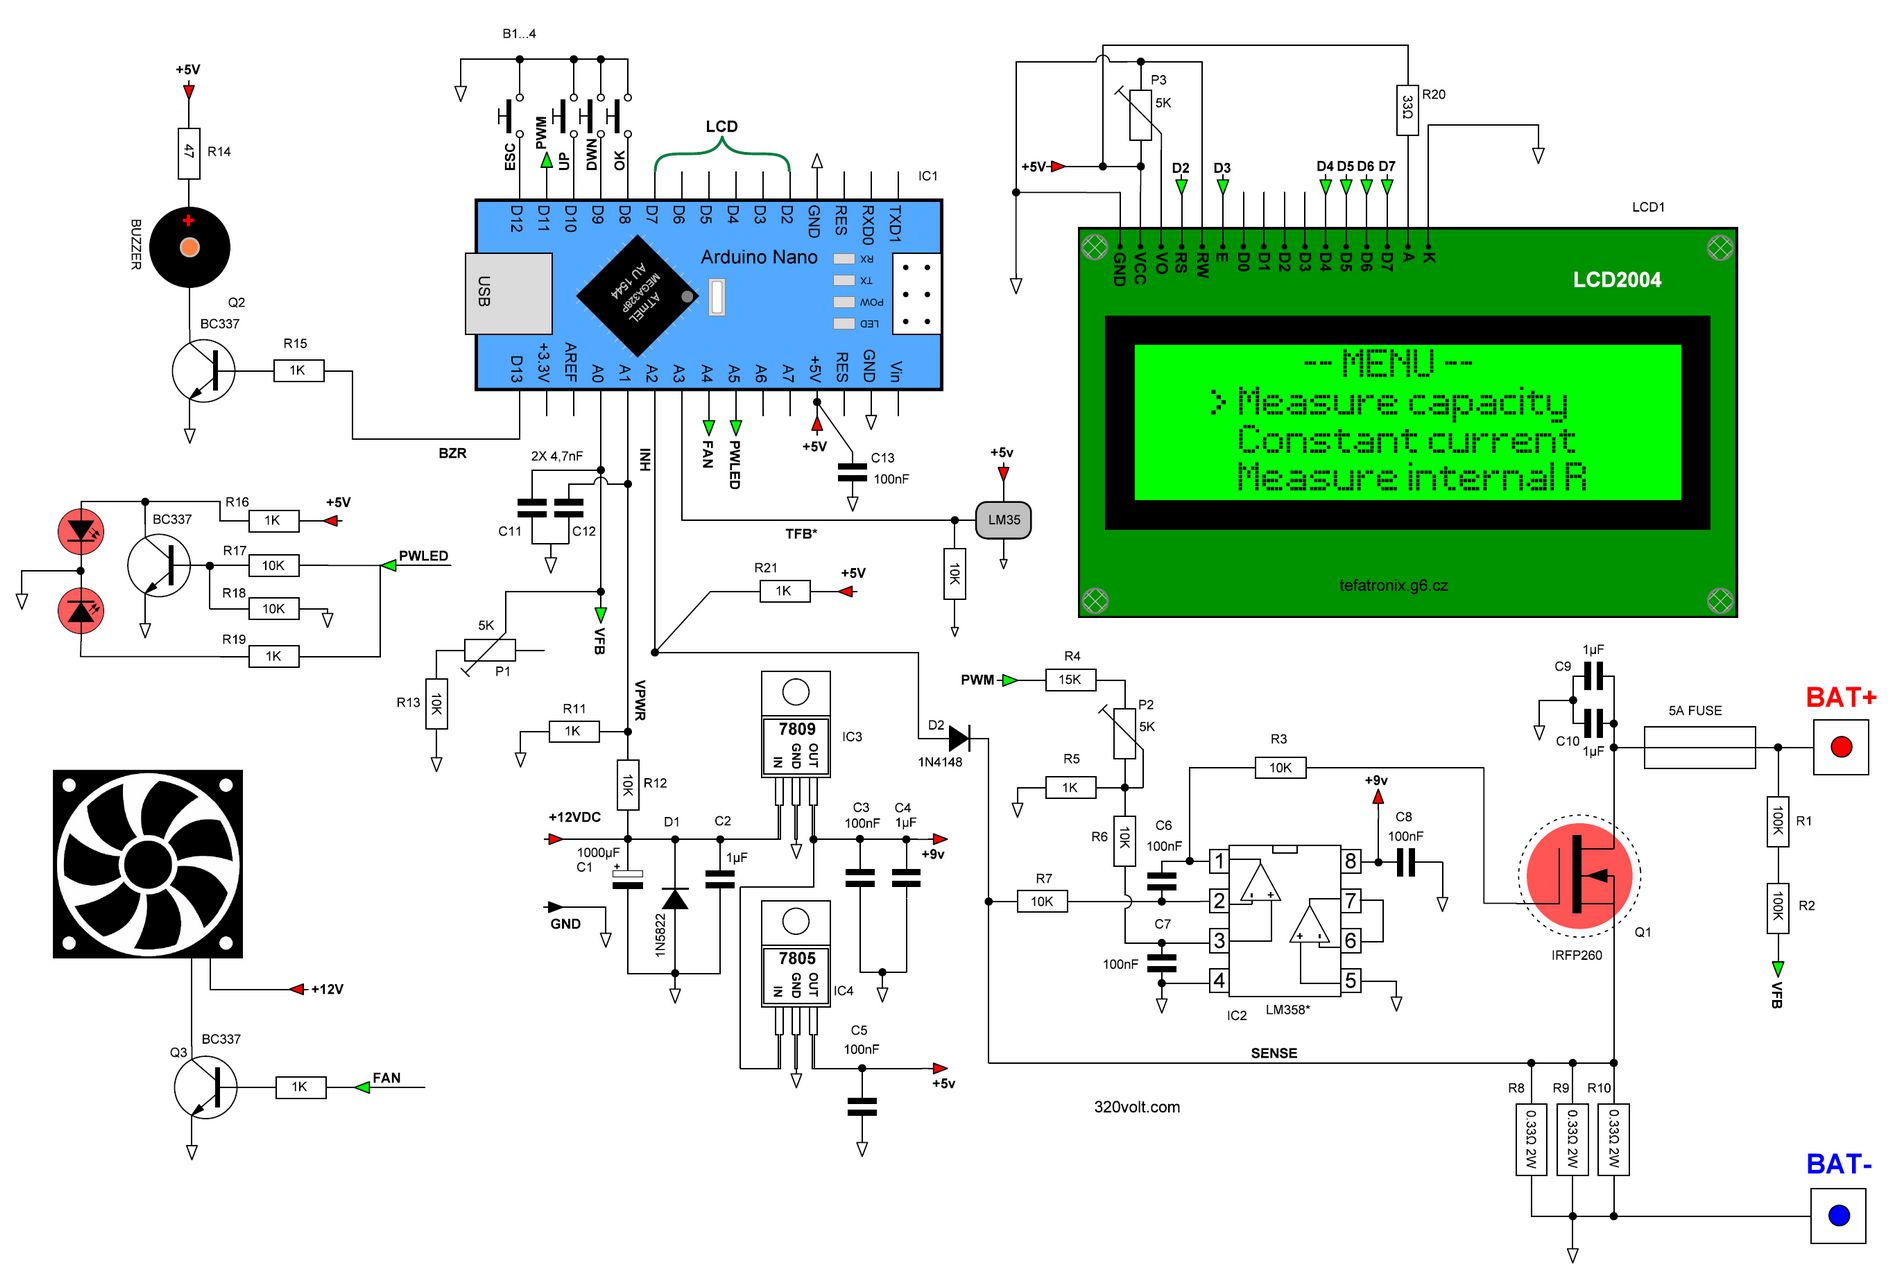
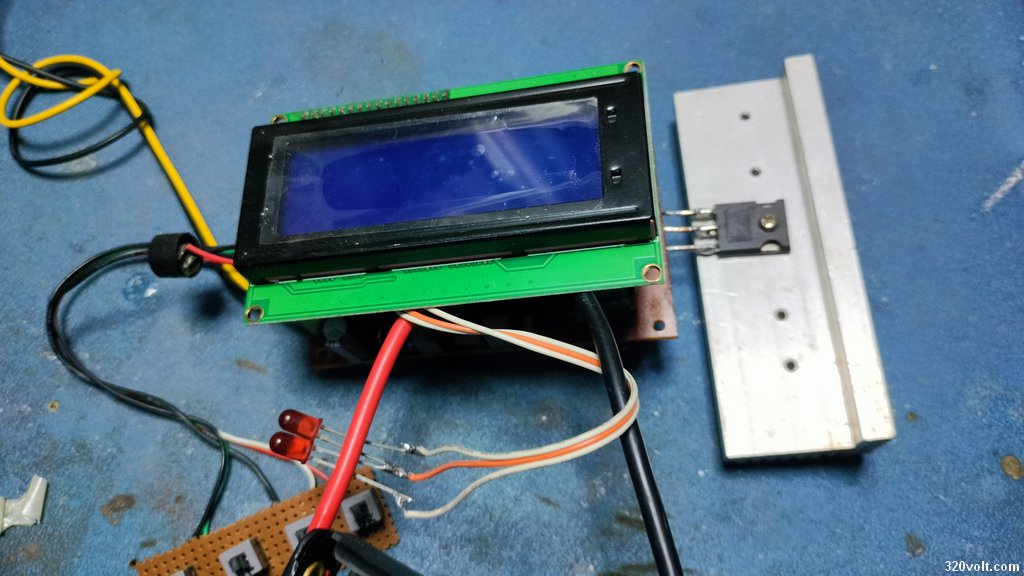
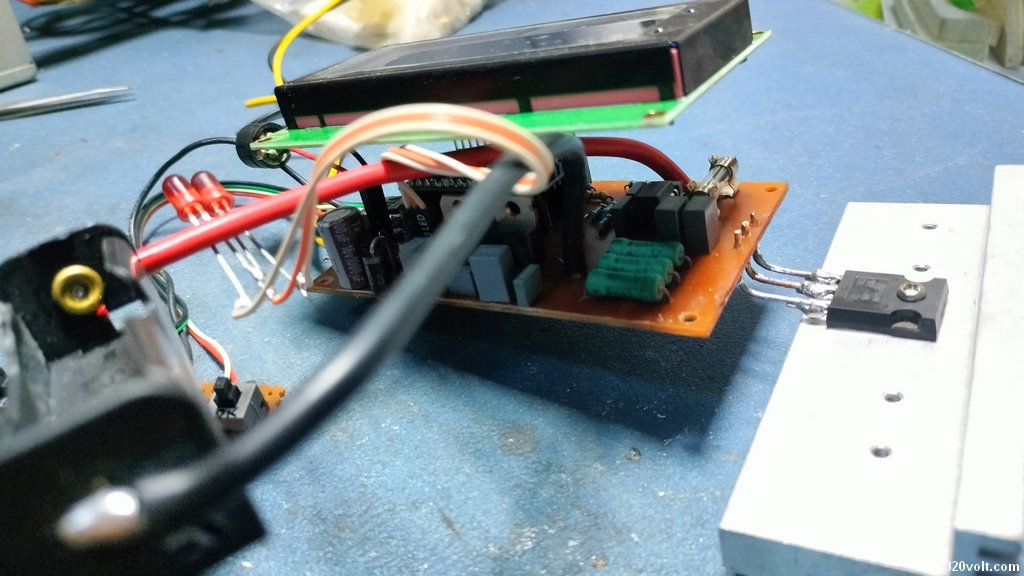
The circuit consists of two main sections: the control section and the load section. The control section includes the Arduino Nano, LCD, buttons, buzzer, fan output, LM35, voltage measurement input, and adjustment components. The load section consists of the PWM filter, LM358 op-amp, IRFP260 MOSFET, shunt resistors, and battery connection.
The Arduino Nano generates a signal from the PWM output. This PWM signal is converted by an RC filter into a voltage close to an analog level.
The op-amp compares this reference voltage with the voltage across the shunt resistors.
The MOSFET gate is driven until the voltage across the shunt resistor reaches the target level. In this way, the circuit tries to draw a constant current from the battery.
This structure is a classic linear electronic load topology. The MOSFET does not operate as a switching element; it operates in the linear region and converts the excess energy into heat.
Therefore, in long-duration and high-current tests, using a large heatsink and a fan for the MOSFET is mandatory.
Main Sections Used
Arduino Nano and Control Section
The Arduino Nano manages the entire menu structure of the device, LCD text, button readings, ADC measurements, EEPROM records, PWM control, and test durations.
While the original circuit used the ATmega328P directly, this adaptation uses the same processor on the Arduino Nano board.
- The LCD data and control pins are connected to the Arduino Nano digital pins.
- The buttons are connected so that they pull the input to GND.
- The battery voltage is applied to the ADC input through resistors.
- The PWM output goes to the RC filter on the load board.
- The fan and buzzer outputs are driven through a transistor.
- The sound setting and ADC offset setting are stored in EEPROM.
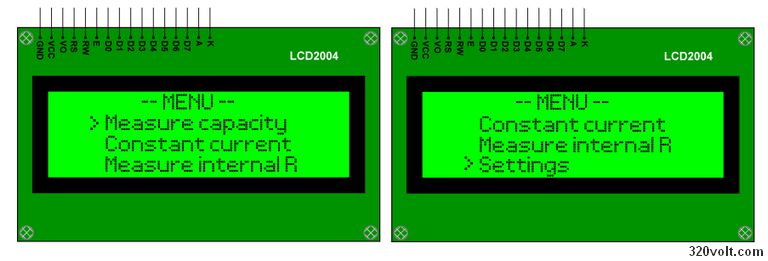
LCD 20×4 Display (LCD2004)
A 20×4 character LCD is used in the project. The LCD displays the main menu, capacity test, constant-current load mode, internal resistance measurement, and settings.
Using a 20×4 display provides a major advantage, because voltage, current, time, mAh, mWh, and test status can be seen at the same time.
Arduino Nano battery tester LCD menu screen
MOSFET and Electronic Load Section
In the load section, a powerful N-channel IRFP260 MOSFET is operated in the linear region. The important point here is that the MOSFET does not only work like a switch that turns the current on and off. A significant amount of power is dissipated on the MOSFET.
For example, when a fully charged 4.2V 18650 cell is tested at 1A, approximately 4W of power is dissipated on the load side.
However, in a high-level test such as 20V at 2.5A, this power can approach 50W. For this reason, thermal design is as important as the software in this circuit.
| Test Condition | Approximate Power | Recommendation |
|---|---|---|
| 4.2V, 1A | 4.2W | Reasonable for 18650 tests |
| 12V, 1A | 12W | Good cooling is required |
| 12V, 2A | 24W | Fan is mandatory |
| 20V, 2.5A | 50W | MOSFET, heatsink, and resistors must be selected carefully |
MOSFET Selection: 18650 Cell Testing and High-Power Use
In this circuit, the MOSFET works as the constant-current electronic load element. In other words, the MOSFET does not operate fully on or fully off like a switching element; it operates in the linear region and allows the desired current to be drawn from the battery.
Therefore, when choosing the MOSFET, attention should be paid not only to the current rating, but also to cooling, package type, and the power that will be dissipated on it.
If currents such as 1A or 1.5A are used in single-cell 18650 tests, the power on the MOSFET is usually at the level of a few watts.
For example, with a fully charged 18650 cell at 4.2V and a 1.5A test current, approximately 6W of power may be generated on the MOSFET. In this case, a well-cooled TO-220 MOSFET is sufficient for most applications.
However, if the device will be used for 12V batteries, higher-voltage battery packs, or long-duration load tests above 2A, a larger-package and more powerful MOSFET such as the IRFP260N should be preferred.
Powerful MOSFET Alternatives That Can Be Used Instead of IRFP260N
| MOSFET | Package | Approximate Class | Recommended Use | Comment |
|---|---|---|---|---|
| IRFP260N | TO-247 | 200V / 50A / 300W | Powerful general-purpose option | Close to the original circuit; suitable for high-power and long-duration tests |
| IRFP250N | TO-247 | 200V / 30A / 214W | Alternative to IRFP260N | Not as powerful as IRFP260N, but sufficient for many battery test applications |
| IRFP264 / IRFP264N | TO-247 | 250V / 38A / 280W | Higher voltage and powerful load tests | Can be preferred in 12V battery and higher-power applications |
TO-220 MOSFET Recommendations for 18650 Cell and 1A – 1.5A Tests
| MOSFET | Package | Approximate Class | Recommended Use | Comment |
|---|---|---|---|---|
| IRFZ44N | TO-220 | 55V / 49A | 18650 cell, 1A – 1.5A test | Easy to find; a good choice for low-voltage battery tests. |
| IRF540N | TO-220 | 100V / 33A | 18650 cell and medium-level load tests | It has a higher voltage rating than 55V MOSFETs. |
| IRF3205 | TO-220 | 55V / 110A / 200W | Low-voltage, high-current applications | More than sufficient for 18650; it can be used in powerful low-voltage loads. |
Which MOSFET Makes More Sense for Which Use?
| Use Case | Recommended MOSFET | Explanation |
|---|---|---|
| Only single-cell 18650, 1A test | IRFZ44N | A small heatsink is sufficient |
| Single-cell 18650, 1.5A test | IRFZ44N or IRF540N | A small/medium-size heatsink must be used. |
| If batteries other than 18650 will also be tested | IRF540N | It is a more flexible choice thanks to its 100V rating. |
| 12V battery or high-power test | IRFP260N | Provides a larger package and better heat dissipation. |
| Long-duration high-current test | IRFP260N or IRFP264 | Must be used with a large heatsink and fan |
If only 18650 cell testing will be performed, using an IRFP260N is not mandatory. TO-220 package MOSFETs such as IRFZ44N, IRF540N, or IRF3205 may be sufficient at 1A – 1.5A levels.
However, the MOSFET must be mounted on a heatsink. Since the circuit operates as a linear electronic load, the heat generated on the MOSFET is directly related to the test current and battery voltage.
Large-package MOSFETs such as the IRFP260N should mainly be preferred when the device is intended to remain general-purpose, when 12V battery tests will be performed, or when long-duration operation at higher currents is required.
Shunt Resistors
Shunt resistors are used on the MOSFET source side for current measurement and regulation.
Three 0.33 ohm resistors are connected in parallel. In this case, the equivalent resistance is approximately 0.11 ohm.
In the original application, the shunt resistors were 1W; I used 2W for better reliability. If you will work with higher voltages and currents, 2W is suitable, and even 3W can be used.
| Current | Expected Voltage Across the Shunt |
|---|---|
| 0.25 A | Approximately 27.5 mV |
| 0.50 A | Approximately 55 mV |
| 1.00 A | Approximately 110 mV |
| 2.00 A | Approximately 220 mV |
| 2.50 A | Approximately 275 mV |
This table can also be used for calibration. When 1 A is selected in constant-current mode, approximately 110 mV should be seen across the shunt terminals.
If this value is very different, the current setting, shunt resistor value, op-amp section, or PWM filter side should be checked.
LM358 and Op-Amp Selection
The original circuit uses an LM358. Since the LM358 can operate from a single supply, is easy to find, and is inexpensive, it is frequently used in this type of circuit.
However, in this project, because the op-amp compares small shunt voltages, offset error directly turns into current error.
The author also mentions this on his page and recommends a quality op-amp for better measurement.
If your goal is only to separate good and bad batteries and you do not need very precise measurements, the LM358 will do the job.
Especially at low currents, the offset value of the LM358 becomes important. When the equivalent shunt resistance is approximately 0.11 ohm, even only 3 mV of offset can create approximately 27 mA of current error.
At a low test current such as 250 mA, this error becomes too large to ignore.
Therefore, using a better-quality op-amp can improve the low-current performance of the device. However, there is a very important detail here: the op-amp supply in the circuit is at the 9 V level. Therefore, op-amps such as MCP6022, MCP6V02, or OPA2333, whose maximum supply voltage is 5.5 V, cannot be used directly.

Op-Amp Options That Can Be Used Instead of LM358
| Op-Amp | Compatibility with 9 V Supply | Advantage | Note |
|---|---|---|---|
| OPA2188 | Suitable | Very low offset, zero-drift architecture | SMD packages are common; an adapter may be required for DIP. |
| OPA2197 | Suitable | Low offset, wide supply range, good overall performance | Quality upgrade option |
| OPA2991 | Suitable | Wide supply range, good price/performance balance | Provides a clear improvement over LM358. |
| TLV9152 | Suitable | Can operate at 9 V, RRIO structure | Affordable and modern alternative |
| LT1013 | Suitable | Higher chance of finding DIP-8 | Classic low-offset alternative |
| TLC2272 | Suitable | DIP-8 may be available, suitable for single-supply operation | Provides improvement over LM358, but it is not the most precise option |
If the op-amp will be changed, the pinout must definitely be checked. The LM358 uses the standard 8-pin dual op-amp structure.
The selected op-amp should have the same pinout, be able to operate from a single 9 V supply, and its input common-mode range should be able to go down to the GND level.
For those interested in LM35, LM358, and fan control circuits, the temperature-controlled fan control circuit example on the site is also related to this section.
LM35 Temperature Sensor and Fan Control
The original project has LM35 temperature sensor support. When the sensor is used, fan control can be performed according to temperature.
For example, the fan turns on above a certain temperature, turns off at a lower temperature, and the device can stop the test in case of excessive temperature.
Since I will use the fan continuously on, I did not add the LM35 and also disabled this feature in the config.h file (line 47: //#define LM35_INSTALLED).
Especially because the MOSFET operates in the linear region, heating during load testing is unavoidable.
For this reason, LM35 support was disabled by default in the Arduino Nano code, and the fan was simplified so that it runs continuously under load.
| Option | Advantage | Disadvantage |
|---|---|---|
| Automatic fan control with LM35 | Quieter operation, temperature-based control | Sensor connection and software setting are required |
| Running the fan continuously | Simpler, safer, less software risk | The fan makes noise continuously |
Arduino Nano Pin Connections
In the Arduino Nano port, the original ATmega328P pin structure was preserved as much as possible.
This allowed the port, timer, and ADC logic of the original software to run without much disturbance.
| Function | Arduino Nano Pin | Description |
|---|---|---|
| LCD RS | D2 | LCD control pin |
| LCD E | D3 | LCD enable pin |
| LCD D4-D7 | D4-D7 | 4 bit LCD data bus |
| OK button | D8 | Menu confirm / left |
| DOWN button | D9 | Decrease value |
| UP button | D10 | Increase value |
| PWM | D11 | Load current control PWM output |
| ESC button | D12 | Exit / right |
| Buzzer | D13 | Audio warning output |
| VFB | A0 | Battery voltage feedback |
| VPWR | A1 | Supply voltage measurement |
| INH | A2 | Load shutdown / inhibit line |
| TFB | A3 | LM35 temperature input, may be unused |
| FAN | A4 | Fan control output |
| PWLED | A5 | Power LED control |
Adapting the Software to Arduino Nano
The original software was written in C. In the Arduino Nano version, the basic measurement logic was preserved and the project was made compilable under the Arduino IDE.
In this process, the project was not completely converted to Arduino’s classic digitalWrite, analogRead, and analogWrite structure.
Because this project is more suitable for direct register control in terms of timing, PWM, and ADC.
Main Software Changes Made
- The original main structure was moved to the Arduino setup and loop structure.
- AVR register usage was largely preserved.
- Timer0, Timer1, and Timer2 settings were adjusted according to the Arduino Nano 16 MHz operating structure.
- Arduino delay and millis usage was not preferred in critical sections.
- The ADC oversampling and averaging logic was preserved.
- Storing sound and ADC offset settings with EEPROM was preserved.
- LM35 support was disabled by default.
- The termination voltage for the capacity test was made safer for Li-ion.
- The internal resistance result was updated to be displayed in mΩ format instead of ohm.
Operating Modes
Measure Capacity
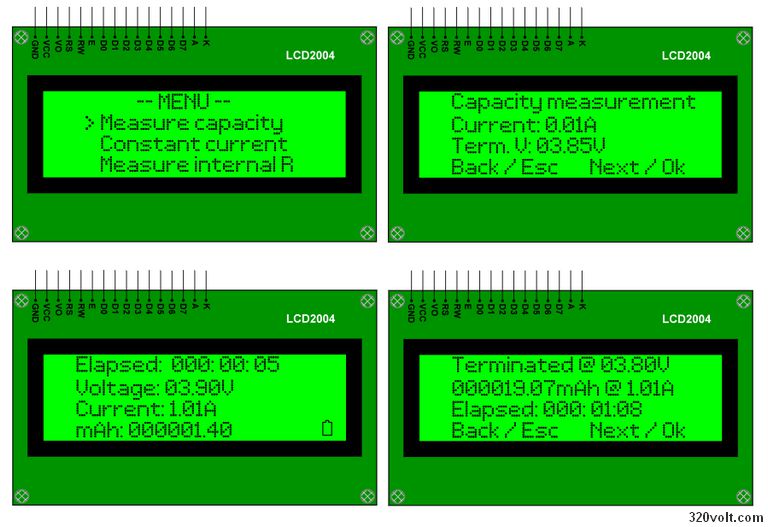
In this mode, the device discharges the battery with the selected constant current. The test ends when the battery voltage falls to the set termination voltage (Term. V).
The software calculates mAh from the elapsed time and current value. In addition, the mWh value can also be calculated from the voltage and current information.
For capacity testing of 18650 Li-ion cells, a current of 1 A and a termination voltage of 3.00 V are good starting values.
If the datasheet information of the tested cell is known, the termination voltage should be selected according to the datasheet value.
Unprotected, old, or unknown-condition Li-ion cells should not be discharged below 2.50 V. For this reason, the software was set to a minimum of 2.50V.
| Battery Type | Recommended Test Current | Recommended Termination Voltage |
|---|---|---|
| Single-cell 18650 Li-ion | 0.5 A – 1 A | 3.00 V |
| High-current 18650 | 1 A – 2 A | 2.80 V – 3.00 V |
| Small Li-ion cells | 0.1 A – 0.5 A | 3.00 V |
| Lead-acid battery | Should be selected according to battery capacity | Should be determined according to the number of cells |
As an example of another application working with similar logic, the Li-ion and Li-pol battery capacity meter STM32 project can also be examined.
Constant Current
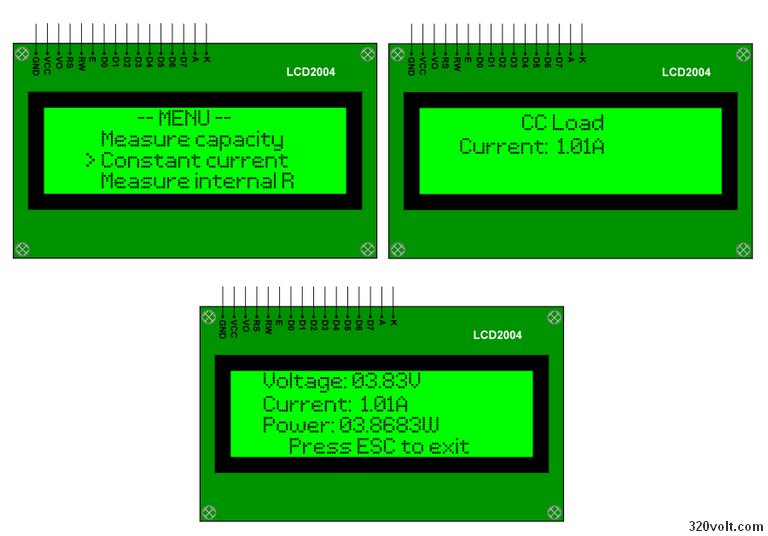
The Constant current mode allows the device to be used as an adjustable electronic load. In this mode, a power supply, adapter, cell, or battery is loaded with the selected constant current. Voltage, current, and power values can be seen on the display.
This mode is especially useful for current calibration. For example, when 1 A is selected, approximately 110 mV should be seen across the shunt.
If the battery voltage and shunt voltage are checked at the same time with an external multimeter, it can quickly be understood whether the device is working correctly.
Measure Internal R
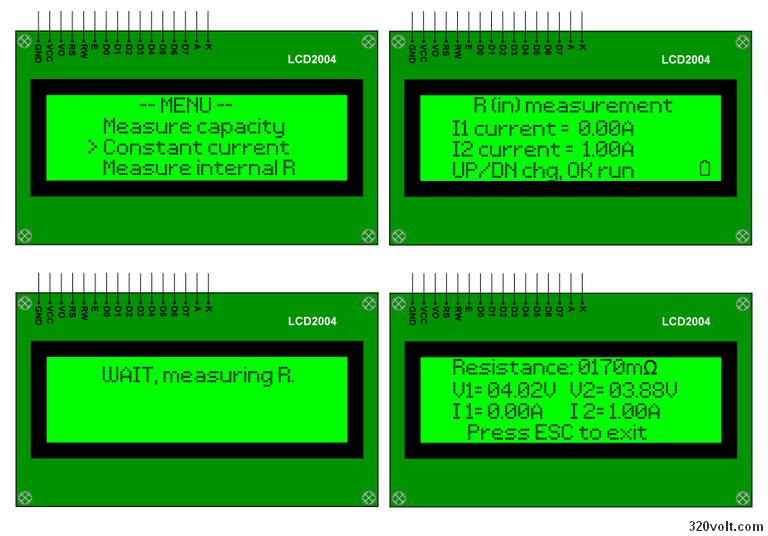
Measure internal R mode is used to approximately measure the internal resistance of the cell or battery. The software selects two different current points.
First, the battery voltage is measured at low current or no load. Then, a second voltage measurement is taken at a higher current.
The difference between the two voltages is divided by the difference between the two currents to calculate internal resistance.
| Selection | I1 | I2 | Comment |
|---|---|---|---|
| Default | 0.00 A | 0.25 A | Light test; it may be more unstable due to the small voltage difference |
| Practical for 18650 | 0.00 A | 1.00 A | Gives a more understandable result |
| Stronger cells | 0.00 A | 2.00 A | Cooling and battery safety should be checked |
The internal resistance result has now been adjusted to be displayed in mΩ. For example, the 00.17 ohm value seen on the old screen is read as 170 mΩ in the new display. This expression is more understandable for a battery.
Selectable I1 / I2 Current Values in Internal Resistance Measurement
| Selection | I1 First Measurement Current | I2 Second Measurement Current | Comment |
|---|---|---|---|
| 0 | 0.00A | 0.25A | Low-current test, default starting selection |
| 1 | 0.25A | 0.50A | Comparison in the low-current range |
| 2 | 0.00A | 0.50A | Transition from no-load measurement to 0.50A load |
| 3 | 0.50A | 1.00A | Comparison in the medium-current range |
| 4 | 0.00A | 1.00A | Practical and understandable selection for 18650 cells |
| 5 | 1.00A | 2.00A | Comparison in the higher-current range |
| 6 | 1.50A | 2.50A | High-current test; battery and cooling must be monitored carefully |
| 7 | 0.00A | 2.00A | Transition from no-load measurement to 2A load |
| 8 | 0.50A | 2.50A | Comparison with a high current difference |
| 9 | 0.00A | 2.50A | Highest no-load to loaded measurement difference |
Effect of I1 and I2 Currents on Internal Resistance Calculation
- In internal resistance measurement, the device first measures V1 voltage at I1 current, then measures V2 voltage at I2 current.
- The calculation is basically based on the logic of R = (V1 – V2) / (I2 – I1).
- In 18650 cell measurement, the most understandable method is generally the selection of I1 = 0.00A and I2 = 1.00A.
- Having the first measurement at 0A makes it possible to reference the approximate no-load voltage of the battery. When a 1A load is applied in the second measurement, the resulting voltage drop is directly used in the internal resistance calculation.
- For example, if V1 = 4.05V, V2 = 3.88V, I1 = 0.00A and I2 = 1.00A, the result is approximately 0.17Ω = 170mΩ.
- Leaving the I1 current selectable is useful for different test scenarios. For example, in some batteries or power supplies, comparison can be made between two different loaded operating points instead of 0A.
- However, in practical use for single-cell 18650 cells, the ideal approach is generally to take the first measurement at no load or 0A and the second measurement at a current such as 1A that creates a sufficient voltage drop.
- This feature has been kept especially for different cell, battery, or power supply measurement work; it has not been fixed only with 18650 cells in mind.
Points to Consider in Internal Resistance Measurement
In this circuit, internal resistance measurement is sufficient for quick comparison, but it should not be considered the same as a professional four-wire Kelvin measurement device.
Because the resistance of connection cables, battery holder, contact resistance, fuse, and PCB traces may be included in the measurement.
For example, while a commercial battery tester may show the same cell as 90 mΩ, this Arduino Nano circuit may show around 160 mΩ – 170 mΩ.
Not all of this difference may be the real internal resistance of the battery. Since two-wire measurement is used, connection resistances also affect the result.
| Point That May Cause a Difference | Effect |
|---|---|
| Battery holder / spring contact | May add extra resistance at the mΩ level |
| Crocodile clip or terminal block | May increase the result depending on contact quality |
| Cable resistance | Low with short and thick cable, high with thin cable |
| PCB traces | May be included in the measurement depending on the current path |
| Measurement duration | Long load duration may increase chemical voltage sag in the battery |
| Test current | Error increases at low current because the voltage difference is small |
How Should the Internal Resistance Value Be Interpreted?
If the internal resistance is low, the battery drops less voltage under load, heats less, and supplies high current more easily.
In other words, as a general rule, the lower the internal resistance, the better the battery. However, the capacity value must also be evaluated together with it.
| Approximate Internal Resistance | Comment |
|---|---|
| Below 100 mΩ | Good battery or more suitable for high current |
| 100 mΩ – 180 mΩ | Normal / usable range on this device |
| 180 mΩ – 250 mΩ | Aged or medium-quality battery |
| Above 250 mΩ | May behave weakly under load |
Therefore, it is more accurate to use this device not as an absolute laboratory reference, but as a practical analyzer that separates good and bad batteries using the same method.
If the same device, same cable, same battery holder, and same test current are used, the comparison results are quite useful.
What Is the Settings Menu Used For?
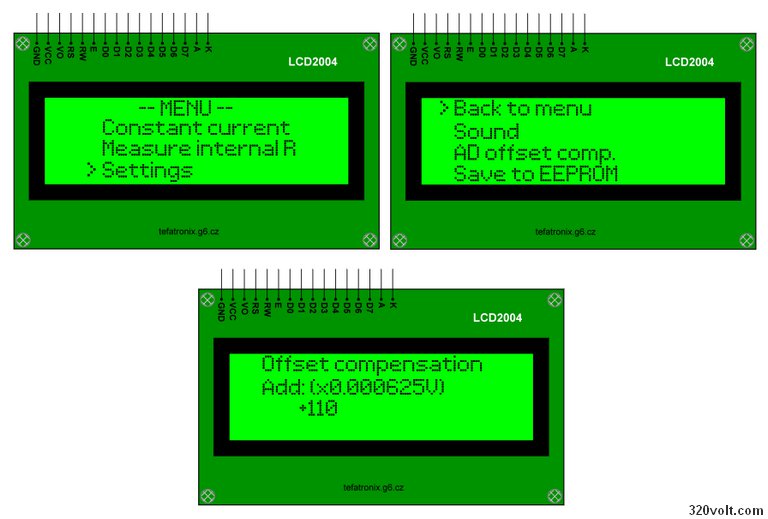
The Settings section includes sound setting, ADC offset compensation, and save-to-EEPROM options.
This menu is not directly one of the test modes, but it affects measurement accuracy and ease of use.
| Setting | Function |
|---|---|
| Sound | Turns the buzzer sound on or off |
| AD offset comp. | Adds or subtracts a small fixed correction to the ADC measurement |
| Save to EEPROM | Saves sound and offset settings to non-volatile memory |
| Back to menu | Returns to the main menu |
AD offset compensation should not be changed randomly. First, the voltage should be made correct with the VFB trimpot.
The offset setting should only be used to correct small fixed deviations.
Software Corrections Made in Measure Capacity Mode
One of the most important problems during the Arduino Nano port was that the elapsed time in capacity measurement advanced too quickly.
This error was caused by the Timer1 setting. Timer1 was rearranged and the 1-second time base was corrected according to the 16 MHz clock frequency of the Arduino Nano.
After this correction, in a real 60-second test, approximately 1 minute should also be seen on the device screen.
In a test lasting 60 seconds at 1 A, a capacity increase of approximately 16.7 mAh is expected.
Another correction was made on the termination voltage side. In the first version, the terminated voltage started from a value such as 0.80 V, which is dangerous for Li-ion cells.
In the new software, the default termination voltage for 18650 tests was set to 3.00 V, and safer limits were preferred to reduce user error.
0.8V – 20V Range and the Safe Termination Limit in the Software
In the original project, the battery measurement range of the device is given as approximately 0.8V – 20V.
This value represents the hardware measurement range of the circuit. In other words, when the VFB measurement line and ADC calibration are done correctly, the device has a structure that can measure cells and batteries at different voltage levels.
However, in this Arduino Nano adaptation, the termination voltage in the Measure capacity section was made safer especially for Li-ion cells.
In the first trials, the termination voltage could start from a very low value such as 0.80V. This value is not suitable for Li-ion and 18650 cells; it can lead the cell to over-discharge.
For this reason, the termination voltage for capacity testing was set by default to 3.00V in the software, and the adjustable lower limit was kept at the 2.50V level.
Thus, discharging Li-ion cells such as 18650 down to very low voltages due to user error was prevented.
| Section | Value | Description |
|---|---|---|
| Original hardware measurement range | 0.8V – 20V | Represents the general voltage measurement capability of the circuit |
| Default termination in Arduino Nano software | 3.00V | Safe starting value for 18650 Li-ion capacity test |
| Minimum termination in Arduino Nano software | 2.50V | Lower limit to reduce the risk of over-discharge in Li-ion cells |
This limitation does not mean that the hardware cannot measure the 0.8V level. It only means that in Measure capacity mode, the automatic test end voltage has been pulled to safer limits with Li-ion cells in mind.
If a lower termination voltage is required for different battery chemistries or special tests, the minimum limit in the software should be changed consciously.
Calibration
Two basic calibrations are required for the circuit to provide correct results: voltage calibration and current calibration.
Without voltage calibration, the capacity test and termination voltage will not be reliable. Without current calibration, the mAh and Wh results should not be expected to be accurate.
Voltage Calibration
The battery voltage comes from the VFB line to the Arduino ADC input. There is a resistor divider and a trimpot on this line.
The actual voltage at the battery terminals is measured with an external multimeter and compared with the value on the LCD. If necessary, the VFB trimpot is adjusted.
- The voltage at the battery terminals is measured with a multimeter.
- The voltage value on the LCD is read.
- The difference is corrected by adjusting the VFB trimpot.
- For small fixed differences, AD offset compensation in the Settings menu can be used.
- After calibration, the settings are saved to EEPROM.
The accuracy of the multimeter used on the measurement side is also important. A basic guide on how to use a multimeter correctly may be useful to reduce common mistakes in multimeter use.
In the first tests, I had to adjust VFB, but there were no large differences; the error was at the mV level, and I fixed it according to the measuring instrument by adjusting the trimpot.
Current Calibration
The most practical method for current calibration is to measure the shunt voltage. When three 0.33 ohm resistors are connected in parallel, the equivalent resistance is approximately 0.11 ohm. At 1 A current, approximately 110 mV should be seen across the shunt.
| Selected Current | Expected Shunt Voltage | Check |
|---|---|---|
| 0.10 A | 11 mV | Op-amp offset effect may be seen at low current |
| 0.50 A | 55 mV | Medium-level check |
| 1.00 A | 110 mV | Main check point for 18650 tests |
| 2.00 A | 220 mV | Cooling must be monitored carefully |
Enter Constant Current mode, set the current, and measure the current drawn from the battery with an ammeter. If you see a different value on the LCD screen, adjust it with the PWM trimpot.
Customization Settings That Can Be Made in the Code
In the Arduino Nano version, some values were deliberately limited for safe use.
Especially in 18650 Li-ion cell tests, the capacity test termination voltage was set so that it does not fall below 2.50V in order to prevent over-discharge.
However, for different battery types, accumulators, or special tests, these limits can be changed from the source code.
1. Changing the Capacity Test Termination Voltage
These settings are located in the global_defines.h file.
The current safe Li-ion setting is as follows:
#define DEFAULT_TERM_VOLTAGE 300
#define MIN_TERM_VOLTAGE     250
#define MAX_TERM_VOLTAGE     420
The values here are in 0.01V units. That is:
- 300 = 3.00V
- 250 = 2.50V
- 420 = 4.20V
This setting is safe for 18650 Li-ion cells. When the device is turned on, the capacity test termination voltage becomes 3.00V and the user cannot go below 2.50V.
Returning to the Original 0.8V – 20V Range
Users who want to open the capacity test termination voltage to the 0.80V – 20.00V range, similar to the original hardware range, can change the same section as follows:
#define DEFAULT_TERM_VOLTAGE 80
#define MIN_TERM_VOLTAGE     80
#define MAX_TERM_VOLTAGE     2000
In this case:
- 80 = 0.80V
- 2000 = 20.00V
However, this setting should be used carefully for Li-ion and 18650 cells. Because if the user accidentally selects a very low termination voltage such as 0.80V, the Li-ion cell may over-discharge and be damaged.
A More Reasonable General-Purpose Setting
For those who want to use the device for both 18650 cells and higher-voltage batteries, a more balanced setting may be as follows:
#define DEFAULT_TERM_VOLTAGE 300
#define MIN_TERM_VOLTAGE     250
#define MAX_TERM_VOLTAGE     2000
With this setting, the device starts at 3.00V and does not go below 2.50V; however, the user can select a higher termination voltage up to 20.00V if desired. This is a more flexible option for applications such as 12V batteries.
2. Changing the Default Discharge Current
The default discharge current is defined in the batmeter_nano.ino file with the following line:
uint8_t pwm_current = 1;This value is also in 0.01A units.
- 1 = 0.01A
- 25 = 0.25A
- 50 = 0.50A
- 100 = 1.00A
- 200 = 2.00A
For example, if the user wants the starting current in the capacity test or constant-current load menu to be 1.00A, it can be changed as follows:
uint8_t pwm_current = 100;For safety, it is better to start with a low value in the first trials. For this reason, a low starting current such as 0.01A or 0.10A can be preferred in new setups.
3. Changing the Default I1 / I2 Current in Internal Resistance Measurement
The current options used in internal resistance measurement are in the following lines of the batmeter_nano.ino file:
uint8_t rin_current_choice = 0;

const uint8_t rin_current1[10] PROGMEM = {0,  25,   0,  50,   0, 100, 150,   0,  50,   0};
const uint8_t rin_current2[10] PROGMEM = {25, 50,  50, 100, 100, 200, 250, 200, 250, 250};
The values here are also in 0.01A units.
- 25 = 0.25A
- 50 = 0.50A
- 100 = 1.00A
- 250 = 2.50A
The default selection is defined by this line:
uint8_t rin_current_choice = 0;In this case, at first startup, internal resistance measurement starts with the 0.00A – 0.25A range.
If a more practical starting point is desired for 18650 cells, the default selection can be set to 4:
uint8_t rin_current_choice = 4;In this case, internal resistance measurement starts by default as follows:
- I1 = 0.00A
- I2 = 1.00A
This selection gives a more understandable result for practical comparison because it creates a more distinct voltage drop in single-cell 18650 cells.
4. Changing Internal Resistance Current Options
If desired, the user can completely change the internal resistance measurement options. For example, if a simpler list is wanted only for 18650, the current arrays can be arranged as follows:
const uint8_t rin_current1[10] PROGMEM = {0, 0, 0, 0, 0,  25,  50,  50, 100, 100};
const uint8_t rin_current2[10] PROGMEM = {25, 50, 75, 100, 150, 100, 100, 150, 150, 200};
In this example list, there are more measurement options that start from 0A and go up to the 0.25A – 2.00A range. However, when changing these values, MOSFET, shunt resistors, battery safety, and cooling must definitely be considered.
5. Enabling or Disabling the LM35 Temperature Sensor
The LM35 temperature sensor setting is located in the config.h file.
If LM35 is currently disabled, the line is as follows:
//#define LM35_INSTALLEDIf the LM35 sensor will be used, the // at the beginning of the line is removed:
#define LM35_INSTALLEDWhen LM35 is enabled, the fan is controlled according to temperature and the device can stop the test in case of excessive temperature. This line should not be enabled when the sensor is not installed. Otherwise, the ADC input may read floating values and incorrect temperature behavior may occur.
6. Changing Fan On / Off Temperatures
If LM35 is actively used, the fan thresholds are changed from the following lines in the config.h file:
#define TEMP_AD_FAN_START  512
#define TEMP_AD_FAN_STOP   446
#define TEMP_AD_FAULT      725
Their approximate equivalents are as follows:
- TEMP_AD_FAN_START 512 ≈ fan on around 55°C
- TEMP_AD_FAN_STOP 446 ≈ fan off around 48°C
- TEMP_AD_FAULT 725 ≈ emergency shutdown around 78°C
If the fan is desired to turn on earlier, the TEMP_AD_FAN_START value can be lowered. If over-temperature protection is desired to be more sensitive, the TEMP_AD_FAULT value can be lowered.
7. Changing the ADC Averaging Count
The ADC averaging values can be changed in the config.h file to make measurements more stable or respond faster:
#define RIN_PREAVG_COUNT     8
#define CAP_PREAVG_COUNT 32- RIN_PREAVG_COUNT affects the averaging count used in internal resistance measurement.
- CAP_PREAVG_COUNT affects the voltage measurement averaging during capacity testing.
If these values are increased, the measurement may become more stable, but the response becomes slightly slower. If the values are decreased, the response becomes faster, but the voltage on the screen may appear more unstable.
8. Changing the Default ADC Offset Value
ADC offset correction is defined by the following line in the config.h file:
#define DEFAULT_OFFSET_COMP 110This value is used when the device is run for the first time or when EEPROM settings are invalid. If the voltage measurement constantly appears lower or higher compared to the multimeter, first the VFB trimpot on the hardware should be adjusted, and this offset value should be used for small fixed deviations.
It should not be changed randomly. An incorrect offset value affects the capacity test termination voltage and the V1 / V2 values in internal resistance measurement.
9. Changing the Default State of Sound Settings
The default state of the sound setting is related to the following line in the config.h file:
#define DEFAULT_SETTINGS 0If the sound is desired to be on by default, this setting can be arranged together with the settings_sound_on bit in the software. However, since the Sound setting can be changed from the Settings menu and saved to EEPROM, it is generally not necessary to change this line.
10. Changing Buzzer Durations
The button sound and finish sound durations are located in the config.h file:
#define BEEP_LEN_BUTTON    10
#define BEEP_LEN_FINISHED  250
#define BEEP_LEN_REPEAT    5
#define BEEP_LEN_START 5- BEEP_LEN_BUTTON button press sound
- BEEP_LEN_FINISHED test finish sound
- BEEP_LEN_REPEAT repeat sound when the button is held down
- BEEP_LEN_START startup sound
If the sounds feel too long, these values can be reduced. If a more noticeable warning is desired, especially BEEP_LEN_FINISHED can be increased.
11. Changing Button Response
Button delay and repeat speed are set in the config.h file:
#define DEBOUNCE_VAL   6
#define REPEAT_PERIOD  30
#define REPEAT_DELAY 250- DEBOUNCE_VAL filters button bounce.
- REPEAT_DELAY determines when repetition starts when the button is held down.
- REPEAT_PERIOD determines the repeat speed.
If the buttons behave too sensitively, the debounce value can be increased. If the value is increased, the button response becomes slightly slower.
12. Changing Display Text
LCD menu text is located in the string_table.h file. For example, the internal resistance measurement menu, capacity test title, or settings menu text can be changed from here.
For example:
const char str_rin_subm1[] PROGMEM = " R(in) measurement ";By changing this line, the title on the screen can be customized. However, since a 20×4 LCD is used, the line length should not exceed 20 characters. Otherwise, the text may overflow or the appearance may be distorted.
13. Changing Pins
Pin definitions are in the config.h file. For example, the fan, LED, buzzer, and button pins can be changed from here.
However, since the pins in this project are used directly with AVR port registers, changing pins is not as easy as Arduino’s digitalWrite logic. Not only the pin number, but also the related PORT, DDR, and PIN definitions must be set correctly.
For this reason, if the PCB will remain the same, it is recommended not to touch the pin settings.
14. Do Not Change the Timer Settings
Timer1 timing values are located in the global_defines.h file:
#define HW_CPU_HZ              16000000UL
#define TIME_PRESCALER_1000ms  ((uint16_t)(HW_CPU_HZ/256UL - 1UL))
#define TIME_PRESCALER_250ms   ((uint16_t)(HW_CPU_HZ/256UL/4UL - 1UL))
These values are set according to the 16 MHz operating frequency of the Arduino Nano. The correct progress of time in Measure capacity mode depends on these settings. Therefore, unless a different clock is used, these lines should not be changed.
15. PWM Frequency and Timer Settings
The current control PWM signal is generated through Timer2. Since this section directly affects the current control stage, it should not be changed by the normal user. If the PWM frequency is changed, the RC filter behavior, LM358 control stability, and MOSFET gate drive may change.
For this reason, only users who understand the behavior of the RC filter, op-amp, and MOSFET are recommended to adjust Timer2 / PWM settings.
Summary
| Change | File | Recommended Use |
|---|---|---|
| Termination voltage | global_defines.h | Can be changed for Li-ion safety or battery tests |
| Default test current | batmeter_nano.ino | A practical starting value such as 1A can be selected |
| Internal resistance I1 / I2 options | batmeter_nano.ino | Can be arranged according to 18650 or battery tests |
| LM35 usage | config.h | Should be enabled if the sensor is installed |
| Fan temperature thresholds | config.h | Can be changed if LM35 is used |
| ADC averaging count | config.h | Can be adjusted for stability / speed preference |
| LCD text | string_table.h | Can be changed to translate or simplify the menus |
| Timer and PWM settings | batmeter_nano.ino / global_defines.h | Generally should not be changed |
Safe Test Sequence
Since this circuit includes both software and power electronics, it should not be rushed during first startup.
Especially before the MOSFET, op-amp, and shunt resistors operate correctly, connecting a battery is risky.
- First, a short-circuit check should be performed with no power applied.
- The 5 V and 9 V regulator outputs should be measured before installing the Arduino Nano.
- The LCD, buttons, and buzzer should be checked separately.
- VFB calibration should be performed with an adjustable power supply instead of a battery.
- In Constant current mode, start with low current.
- The 0.1 A, 0.2 A, 0.5 A, and 1 A steps should be tested.
- The shunt voltage should be verified with a multimeter.
- Fan operation and MOSFET temperature should be monitored.
- The termination voltage should be checked with a small test.
- The real 18650 capacity test should be done last.
Cooling and Power Rating
Because the load section of this device operates linearly, it generates heat. If cooling is weak, the MOSFET can overheat in a short time.
Therefore, the MOSFET should be mounted on a large heatsink, the fan should run continuously, and the thermal contact should be good.
The power rating of the shunt resistors should also not be neglected. Since 0.33 ohm resistors are used in parallel, the total power is shared.
However, if the resistor tolerances and solder joints are not equal, current sharing may also not be exactly equal.
If you are interested in higher-power electronic load projects, the LM324 electronic load 8 MOSFET 600W project on the site can also be examined as a different approach.
Recommended Starting Settings for 18650 Testing
| Setting | Recommended Value | Description |
|---|---|---|
| Measure capacity current | 1.00 A | Practical test current for a single 18650 |
| Terminated voltage | 3.00 V | General and safe Li-ion cutoff level |
| Internal R test | 0.00 A – 1.00 A | Gives a more understandable result than the 250 mA option |
| Fan | Continuously on | Keeps the MOSFET temperature under control |
| Connection cable | Short and thick | Reduces internal resistance measurement error |
Arduino Battery Tester Test Video
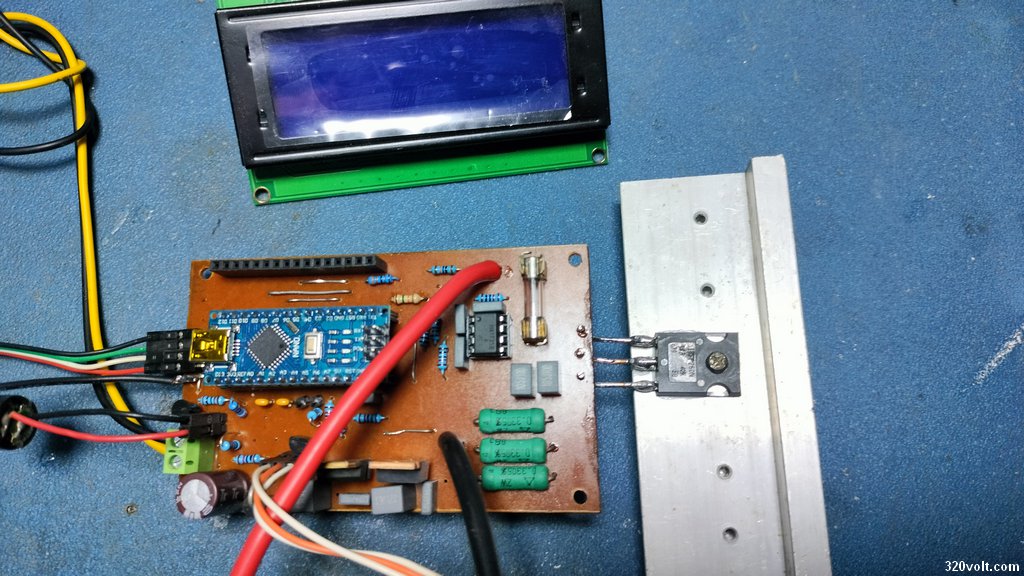
Arduino Battery Analyzer PCB Design
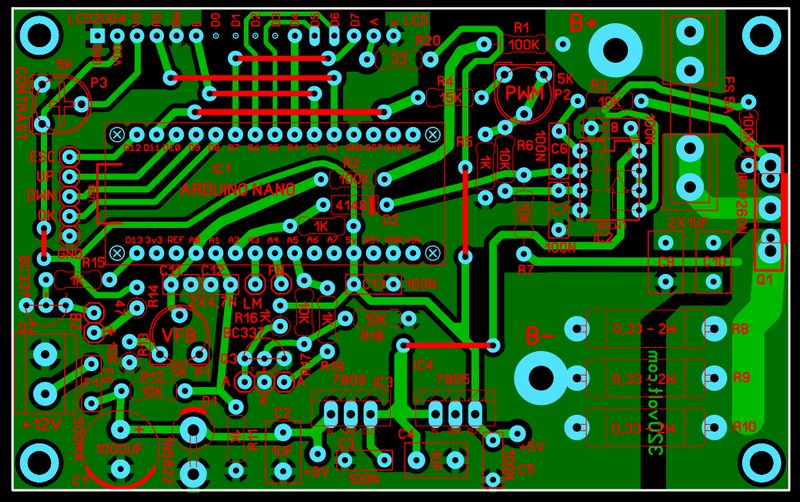
The PCB was prepared with Sprint Layout 6; its dimensions are 100x62mm. The battery connection and MOSFET traces were kept very thick and short.
Especially in internal resistance measurement, the effect of the fuse is large, but it is necessary for safety. Therefore, a direct connection was not made.
Direct Arduino pin outputs were provided for Fav and LM35. If you will use these sections, you must also connect the passive components.
The resistor and transistor components for the buzzer and LED indicator are available on the PCB. The buttons are connected directly to the pins.
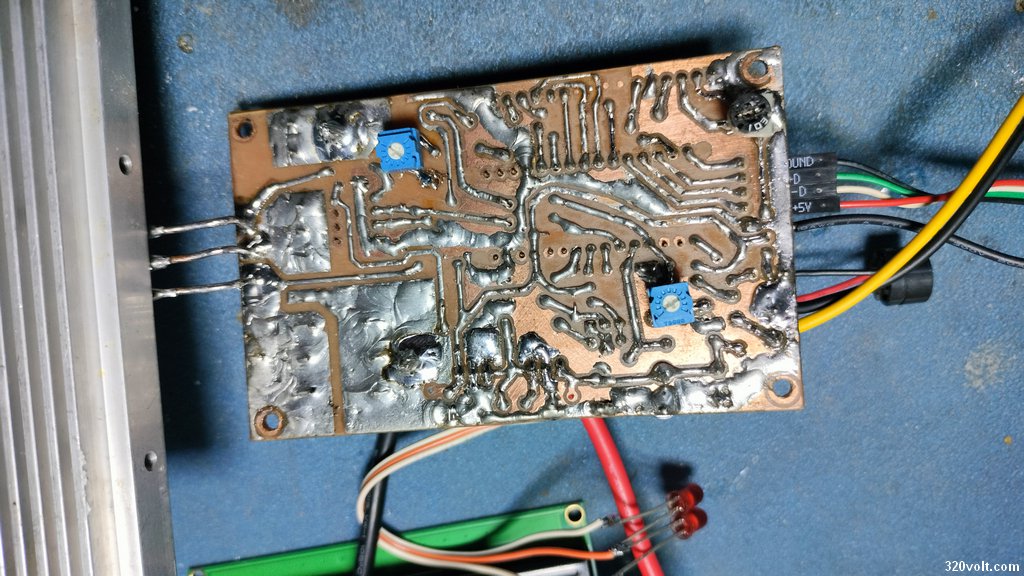
To perform calibration while the circuit is running, the trimpots should be soldered to the back side of the PCB.
I powered the circuit in the first trial. There is no PCB error, but for the first setup the Arduino and op-amp were placed in sockets.
I added a 100K resistor from the MOSFET gate pin to ground, but I did not use this resistor in the actual application.
At startup, the MOSFET gate may remain floating for a short time until the op-amp output settles. It may be needed for extra safety.
If you will not use the Arduino for different purposes and you are confident 🙂 solder it directly without using a socket.
The fewer sockets, the better the conduction….
Conclusion
This battery and accumulator analyzer device prepared with Arduino Nano is useful in the workshop for sorting batteries, measuring capacity, making approximate internal resistance comparisons, and testing small power supplies with constant current.
It does not completely replace professional battery analyzers; however, with correct calibration, good connections, and safe test current, it provides quite useful results for hobby and service environments.
Especially for those working with 18650 cells, the most important benefit of the device is that it can evaluate batteries not only by looking at their voltage, but together with capacity, voltage sag under load, and internal resistance behavior.
With the same test setup, it becomes quite easy to separate good, medium, and weak batteries using this device.
Software conversion, debugging, and update work received extensive support from ChatGPT.
During the porting of the original code to Arduino Nano, many software adjustments were made, such as adapting the main structure to the setup and loop structure, reviewing timer settings, preserving the ADC and PWM structure, keeping EEPROM settings functional, and using the LCD menu structure without breaking it.
The current version works properly in workshop tests. Still, the project has a structure that is open to further development.
Different op-amp trials, a Kelvin connection arrangement for more precise internal resistance measurement, special test profiles for different battery types, or more advanced display options can be added in the future.
I also shared the project on my GitHub page. https://github.com/gevv/arduino-battery-analyzer/ You can examine the codes, try them in your own circuit, report bugs, or contribute to improvements.
Especially test results with different battery types and improvement suggestions will help make the project more useful.