LM3915 The connection stands and falls with analog amplification and filtering of audio signals using operational amplifiers. The audio signal is first amplified and impedance separated by connection with the operational amplifier IC9 TL071. Negative feedback (and thus signal amplification) is affected by the TR1 680k trimmer. You can calculate how many times IC9 will amplify the input signal according to the formula A = -TR1 / R49. The gain is negative for us, because the input signal is inverted by the amplifier (the positive half-wave of the signal becomes negative and vice versa). During the test calculations, you come to a simple conclusion – the smaller the trimmer resistance, the stronger the negative feedback of the amplifier and the smaller its gain (and thus the input sensitivity of the entire device).
We supply our amplified (or even attenuated) audio signal to eight active bandpass filters. The task of such a pass is to pass only a certain frequency component of the input signal and to attenuate the others as much as possible. We determine the quality or steepness of the bandpass filter using the dimensionless coefficient Q, in the case of our filters Q is equal to 10. The higher the value of Q, the steeper the filter and the narrower frequency band. Using the formula for the bandwidth B = f / Q [Hz], we find out which signals are passed by the filter and which, on the contrary, are significantly suppressed. For simplicity, let’s choose the bandpass for f = 1kHz. The bandwidth will then be B = 1kHz / 10, ie B = 100Hz. This means that this filter only passes signals whose frequencies range from 950 to 1050Hz (fL = f-B / 2, fH = f + B / 2).
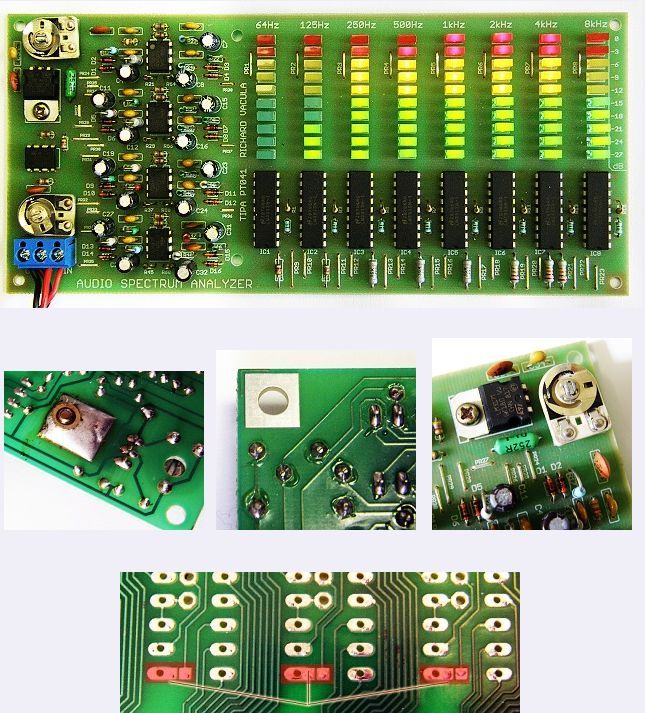
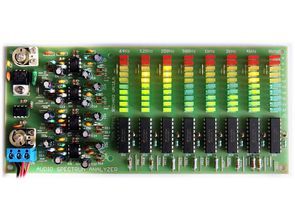
Simply put, we use eight filters to split the signal into eight parts according to frequency. We then direct each “part”, or the newly created signal, which creates only an amplitude envelope determining the intensity of the signal at a given moment. This rectified audio signal is then fed to the input of the LM3915 excitation logarithmic indicator, which lights up 0 – 10 LEDs depending on the voltage level of the supplied signal. Thanks to this butchery, ie filtering (portioning) of the signal, we can display the intensity of depths, middles, up to heights separately. The bass guitar will affect the first two LED bars (64, 125Hz), while cymbals and other rattles will affect the indication of the last two LED bars (4, 8kHz). The guitar, on the other hand, takes on the middle band.
Tips; Start with jumpers and then continue from the lowest to the highest components. Screw the IC14 to the PCB with a screw and nut. Tin the surface under IC14 so that the heat of the controller spreads as much as possible into the printed circuit board. The two lower screw holes also have solder pads for possible soldering of hard wires for the purpose of constructing a simple stand. For each LM3915 circuit (IC1 to IC8) you will find shorting jumpers (two tinned pads very close to each other). By connecting them, you switch the indication to belt mode. You will remain in point mode without connection.
FILE DOWNLOAD LINK LIST (in TXT format or file): 26662b.rar pass: 320volt.com
Source: stavebnice.postreh.com

Do you have a purchasable PCB for this project?
Hi, No sales. The files required for the construction of the circuit were shared
Hello can you share with me the schematic file .
Hello, can you share the schematics for this pcb please?
Hello,
https://320volt.com/en/wp-content/uploads/2021/09/26662b.rar password: 320volt.com