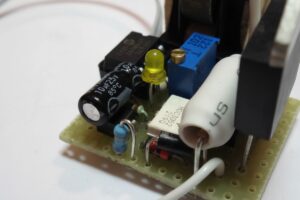
Ampere measurement, ammeter circuit made with pic16f84 microcontroller, UGN3503 hall effect sensor output used for current sensor is powered by lm358 op amp and connected to RB0 pin of 16f84 integrated current information is displayed on led display (lts542r) microcontroller, a good example for current measurement with hall effect sensor
Compact 0-80A Automotive Ammeter Our PIC16F84 based automotive projects project It’s very rare now to see an ammeter installed in a car. Instead, almost all modern (and not so modern) vehicles have a light that indicates battery charge. Normally, this lamp goes off when the engine is running and only illuminates when the alternator fails. Other than that, it provides no other information during normal driving.
This means that when the light goes out, you don’t know how much current is entering or leaving the battery.
However, you want to know more about battery charge and discharge rates. This Automotive Ampere meter circuit can provide this information with a high degree of accuracy.
PIC16F84 Ampere Meter Circuit Main Features
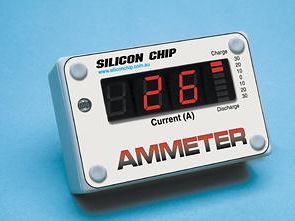
- Includes 7 LED graphic display and 2-digit readout
- ±0-30A indication on ledbar in 5A steps
- 1A resolution on 2-digit display
- Typical 80A maximum reading
- Dual indicator for charge and discharge
- Automatic screen dimming in low light conditions
Why is it important to know the state of charge of the battery; It is important because it is an important component of the electrical system of vehicles. If the battery isn’t charging properly, you may be stranded.
With the engine running, the alternator normally provides all the power for the electrical loads and continues to charge the battery. However, if there is insufficient charging current, the battery will gradually discharge. This can occur if the electrical load is high when the engine is idling, or the connections to the battery are faulty, or the battery itself is dead.
Measuring battery current involves measuring the current flowing to one of the battery’s terminals at all ends. In addition, it is necessary to determine the direction of the battery so that we know when the battery is being charged or discharged.
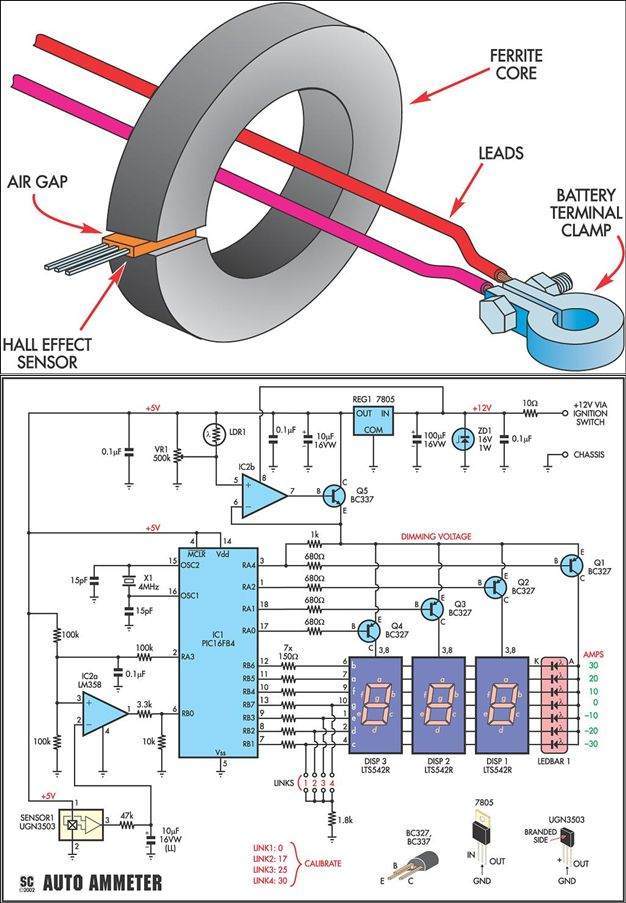
Hall effect sensor
The PIC16F84 microcontroller processes the signal from the Hall effect sensor and drives the 7-segment LED displays and LED bar. LDR1, VR1 and IC2b automatically change the screen brightness depending on the ambient brightness.
The ammeter measures the battery current using a Hall effect sensor. This monitors the magnetic field produced by the current in the battery cables.
A ferrite core placed in the Hall sensor air gap is placed around the battery cables. The leads from the battery produce a magnetic flux when current flows and this is excited into the ferrite core. This magnetic flux then passes through the sensor, which produces a voltage proportional to the current in the wires.
Moreover, the output of the Hall effect device becomes positive for one current direction and negative for the other. Thus, the same sensor can determine both the magnitude and direction of the current.
Current Meter Circuit Main Features
The vertical LED bar graph on the right side of the front panel consists of seven LEDs and operates in dot mode. The center LED shows zero amps (0A), while the three LEDs above it light up gradually in 10A steps for currents of 10-19A, 20-29A, and 30A and above.
The current sensor consists of a ferrite core with a Hall effect element placed in the air gap, placed around the battery cables. When current flows through the electrodes in the ferrite, a magnetic flux is excited and this flux passes through the Hall effect element, which produces a proportional output voltage.
The resolution of the ledbar has been slightly increased by making it possible to light more than one LED at a time. Thus, the 0A and 10A LEDs light up for currents between 5-9A; The 10A and 20A LEDs illuminate for currents between 15-19A; and the 20A and 30A LEDs illuminate for currents between 25-29A.
The three LEDs below the 0A LED indicate discharge current and work exactly the same – but in the opposite direction.
It changes the screen brightness according to the light level of the environment. That way, the screens are nice and bright for daytime viewing but are turned off to be distracting at night. The degree of screen dimming can be adjusted with the trimpot.
Specifically, the maximum reading is 80A and the resolution is 1A. If the current goes above 80A, the unit will overload and will read “OL” in the center and left 7-segment readings.
Circuit details
The PIC16F84 microcontroller works as an A/D converter. In simple terms, this converts the analog voltage produced by the sensor into a digital value that is then used to power LED displays.
The DC signal output from the Hall sensor goes to pin 2 of the comparator stage IC2a through a filter consisting of a 47kΩ resistor and a 10μF capacitor. This filter circuit removes any ripple voltage from the Hall sensor output.
The output from the Hall sensor is nominally 2.5V when no magnetic field is applied. At the same time, pin 3.5 of IC2a is biased to 2.5V using two series 100kΩ resistors across the 3.5V supply.
The associated 100kΩ pulls the IC1’s resistor RA3, when RA2 is 5V, pin 3 input of IC2a is pulled to 1.67V, or when RA3 is grounded to 3.33V. However, it follows that if RA3 is repeatedly quickly switched between +5V and ground, pin 3 of IC2a can be set to any voltage between 1.67V and 3.33V depending on the duty cycle of the switching waveform.
In operation, the A/D converter uses IC1 to ensure that the voltage applied to pin 3 of IC2a matches the sensor output voltage applied to pin 2, it does this by generating a 1953Hz pulse width modulated (PWM) signal at output RA3, the duty cycle is adjusted to continuously supply the required voltage at pin 3 of IC2a.
For example, if the duty cycle on RA3 is 50%, the average voltage output will be 2.5V. This is filtered by a 0.1μF capacitor and applied to pin 3. Other voltages are obtained using different duty cycles as mentioned above.
The IC2a simply acts as a comparator. The pin 1 output is switched low or high depending on whether the voltage at pin 2 is higher or lower than the voltage on pin 3. The output from IC2a is then fed to RB0 with a 3.3kΩ limiting resistor. This is included to limit current flow from IC2a when its output is high; ie + 12V. The internal clamp diodes in RB0 then limit this voltage to 0.6V above the 5V supply of IC1 (i.e. +5.6V).
Note the 10kΩ pull-up resistor on RB0. This ensures that the signal on RB0 is detected as low when pin 1 of IC2a goes low.
Initially, the RA3 operates with a 50% duty cycle and the internal register in IC1 is set to 10000000. IC1 then checks the output of the comparator IC2a to see if it goes high or low. It then adjusts the duty cycle on RA3 by a certain amount, updates the register, and rechecks the IC2a output.
This process continues for eight cycles, with each step successively adding or subtracting a smaller amount of voltage to pin 3 of IC2a. During this process, the lower bits in an 8-bit register are repeatedly set to 1 or 0 to achieve an 8-bit AD conversion.
After the conversion, the binary number stored in the 8-bit register is processed (we’ll look at this in more detail shortly) and converted to a decimal value so that it can be displayed on the 3-digit LED display. Once again, this is happening inside the PIC16F84 microcontroller.
Note that the possible range of values for an 8-bit register is 00000000 (0) to 11111111 (255) – that is, 256 possible values. However, in practice it is limited to about 19-231. This is because the software has time for internal processing to generate the waveform at output RA3 and monitor input RB0.
Processing of register data: Let’s take a closer look at how the PIC16F84 microprocessor processes data in the 8-bit register following conversion. To do this, it requires several information items.
First, it needs to know the voltage produced by the Hall effect sensor when there is no current flow. This is nominally half the supply voltage (i.e. 2.5V) but can be anywhere between 2.25V and 2.75V. This value is determined during the setup procedure by installing Link 1, which pulls the RB1 line down with a 1.8kis resistor.
Second, the processor needs to know what the output voltage from the Hall effect sensor is for a known current. This is measured at either 17A, 25A or 30A with Link 2, Link 3 or Link 4 installed on outputs RB2, RB3 and RB7.
The Hall effect normal output voltage is then subtracted from this measured value to obtain a calibration number.
For example, let’s say the output of the Hall effect sensor is 2.5V at 0A and 3.0V at 17A (i.e. we calibrate at 17A). In this case, the calibration factor will be 3 – 2.5 = 0.5, which is stored by the processor along with the calibration amp (in this case 17A).
Once the processor has learned this information, it can calculate other currents based on the output of the Hall sensor. First, it subtracts the quiescent voltage of the sensor from the new output voltage (note: this provides values that can be positive or negative depending on the current direction). The result is then multiplied by the calibration amp and divided by the calibration factor to get the final result.
Suppose the calibration factor is 0.5 and the calibration amperage is 17A. Also, suppose the sensor output is at 3.4 V. In this case, the current would be (3.4 – 2.5) x 17 / 0.5 or 30.6A. This result (to the nearest amperage) is shown on the LED indicators and bar.
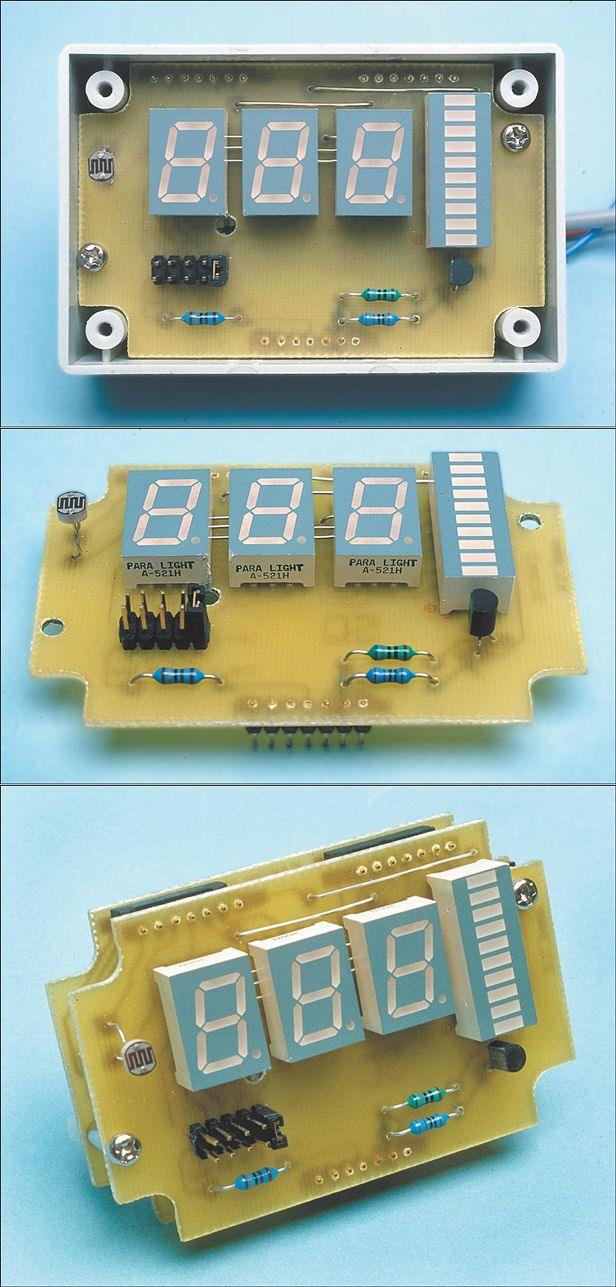
Driving LED Indicators
7-segment display data from IC1 appears on outputs RB1-RB7. These drive the display segments directly with 150-ohm current-limiting resistors, while outputs RA0, RA1, RA2, and RA4 switch between transistors Q1-Q4, making individual displays versatile.
As shown, the corresponding screen segments are all interconnected, while the common anode terminals are driven by switching transistors. Similarly, the cathodes of the LEDs in the bar display (LEDBAR1) are also connected to the display sections.
After this screen lights up for a short time, RA0 is upgraded and DISP3 turns off. The 7 segment display data in RB1-RB7 is then updated and then RA1 shows low and DISP2 to driver Q3. RA2 is then lowered to drive DISP1 and finally RA4 is lowered to return to the LED bar graph.
Note that the RA4 output of IC1 has a 1kΩ pull-up resistor connected to the emitter supply line for transistors Q1-Q4. This is necessary to ensure complete closure of Q1 as RA4 has an open drain output.
Between the drive DISP1 and the LED bar graph, outputs RB1-RB7 are set as inputs. These have internal pull-up resistors that keep them high unless they are pulled low with one of the connections (i.e. Connections 1-4) and the corresponding 1.8kΩ resistor. By monitoring the status of these RB inputs, we can determine if one of the connections has been established for calibration.
Connection 1 tells the processor that the voltage from the Hall effect sensor is at a stagnant level (ie when there is no current flowing through the battery cable). The other three links determine the current level used for calibration (you only need to select one).
For example, if Link 2 is shorted, the processor knows that the voltage output from the Hall sensor corresponds to a current of 17A. Connections 3 and 4 are used for alternating current calibration levels of 25A and 30A, respectively.
Trimpot VR1, light dependent resistor LDR1 and op amp IC2b are used to control screen brightness. As shown, IC2b is connected as a voltage follower and display driver transistors Q1-Q4 drives buffer transistor Q5 to control the voltage applied to the emitters.
When the ambient light is high, LDR1 has low resistance and so the voltage on pin 5 of IC2b is close to the +5V supply rail given by REG1. This means that the voltage at the Q5’s emitter will also be close to +5V and the displays are running at full brightness.
As the ambient light falls, the resistance of the LDR increases and thus the voltage at pin 5 of the IC2b drops. As a result, the emitter voltage of the Q5 also drops, thereby reducing the brightness of the displays.
At low light levels, the resistance of the LDR is very high and the voltage on pin 5 of IC2b is adjusted by VR1. This trimpot sets the minimum brightness level and is easily adjusted to give a comfortable screen brightness at night.
The circuit’s power is obtained from the vehicle’s battery with a fuse and ignition key. This is fed through a 10-ohm resistor and filtered using 0.1μF and 100μF capacitors. Zener diode ZD1 provides transient protection by limiting any inrush voltage to 16V. It also provides reverse polarity protection – if the leads are reversed, the ZD1 will draw a lot of current and burn the 10-ohm resistor
For 3-wire connection to the Hall sensor, use double-core shielded cable.
Hall effect
The sensor must be installed on the ferrite core with the spacers attached and the assembly assembled. You can attach the core to the positive or negative battery wire, but all wires connected to a battery terminal must pass through the core.
Check that the ammeter display shows the “-” sign while the battery is discharging. You can check this by turning on the headlights with the engine off. If the minus sign is off, open the ferrite core, rotate the assembly 180° and replace over the wire or wires.
Finally, the Hall effect sensor assembly must be tied together with cable ties and covered with a layer of silicone sealant to keep out dirt and moisture.
Source: http://www.siliconchip.com.au/cms/A_30551/article.html PIC16F84 Ammeter Circuit 0-80A UGN3503 pic assembly source code schemmatic pcb alternative link:
Aleph-30 Class-A Power Amplifier Circuit
The Pass Aleph 30 is the first of the second generation of Aleph single-ended Class A power amplifiers. This design results from my commitment to create the best sounding product, a simple circuit having the most natural characteristic. The Pass Aleph 30 integrates power Mosfet devices and pure single ended Class A operation in a simple two-gain-stage topology with the sole purpose of recreating subjectively natural sound.
Aleph-30 Class-A Amplifier Projec